
Introduction:
Memory management is a critical aspect of iOS development, and one of the most challenging issues developers face is memory leaks. These silent culprits can degrade app performance over time, leading to crashes and diminished user experience. In this blog post, we’ll delve into the world of Swift debugging, focusing on identifying and addressing memory leaks in iOS development.
1. Understanding Memory Leaks:
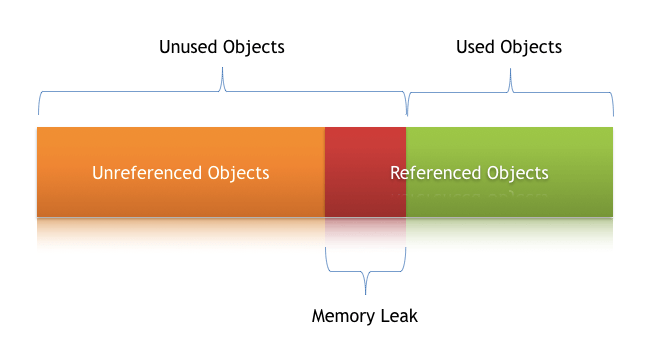
A memory leak occurs when an application allocates memory but fails to release it, leading to a gradual accumulation of unused memory. In Swift, memory leaks typically involve reference cycles where objects maintain strong references to each other, preventing the system from deallocating them.
2. Use Instruments for Profiling:
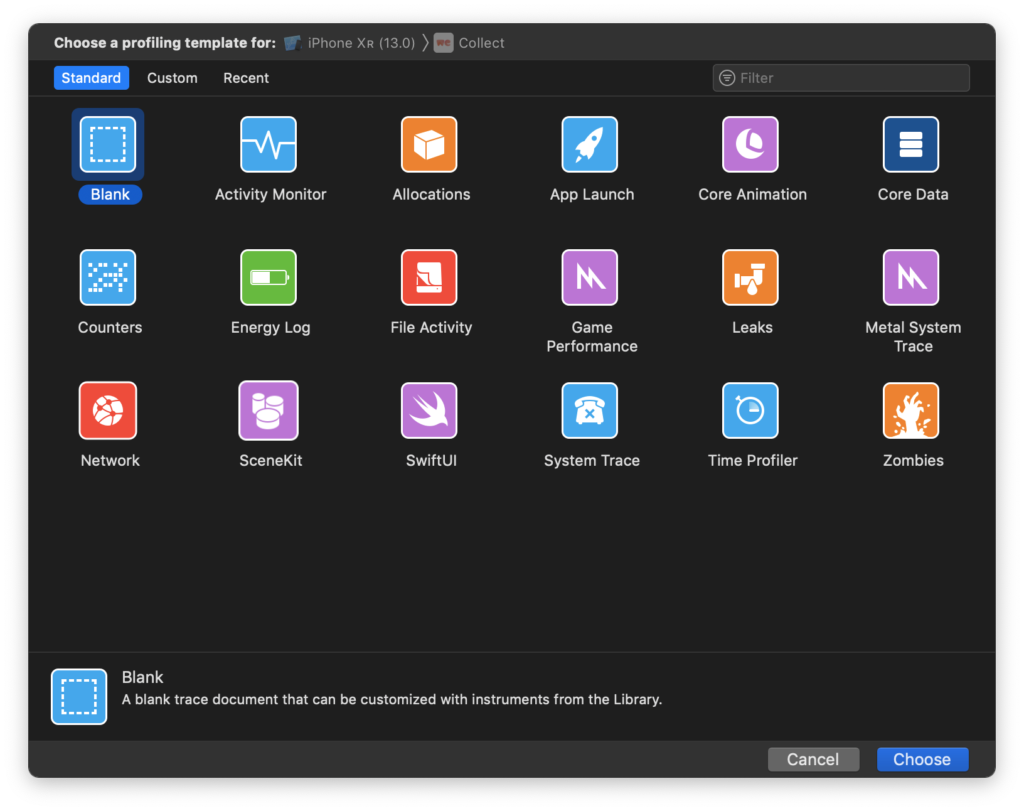
Xcode comes equipped with a powerful tool called Instruments, specifically designed for profiling and debugging applications. The “Leaks” instrument allows developers to identify memory leaks by analyzing the allocation and deallocation of objects during runtime.
3. Identifying Retain Cycles:
Retain cycles, also known as strong reference cycles, are a common cause of memory leaks. They occur when two or more objects hold strong references to each other, creating a cycle that cannot be broken by the automatic reference counting (ARC) system.
Use the “Memory Graph” in Instruments to visualize object relationships and identify retain cycles. Look for strong references between objects that form closed loops.
4. Weak and Unowned References:
Swift provides mechanisms to break strong reference cycles, such as using weak and unowned references. When appropriate, replace strong references with weak or unowned references to allow objects to be deallocated when they are no longer needed.
swift
class ObjectA { weak var objectB: ObjectB? } class ObjectB { var objectA: ObjectA? }
5. Delegation Patterns:
Be cautious when using delegation patterns, as they can inadvertently create retain cycles. Make use of the weak keyword when defining delegate properties to avoid strong reference cycles between the delegator and delegate.
swift
protocol SomeDelegate: AnyObject { func didPerformAction() } class SomeClass { weak var delegate: SomeDelegate? }
6. Unregister Observers:
NSNotificationCenter and KVO (Key-Value Observing) can introduce memory leaks if observers are not unregistered. Ensure that you remove observers when they are no longer needed to prevent strong reference cycles.
swift
// Example: Removing observer NotificationCenter.default.removeObserver(self, name: Notification.Name.someNotification, object: nil)
7. View Controller Lifecycle Management:
Memory leaks often occur in the context of view controllers. Be mindful of strong references to view controllers, especially when using closures or delegates. Utilize [weak self] in closures to avoid strong reference cycles.
swift
networkService.performRequest { [weak self] result in guard let self = self else { return } // Process result }
8. Testing with Debugging Tools:
Regularly test your application using Xcode’s debugging tools, such as the “Debug Memory Graph” option. This tool allows you to interactively explore your app’s object graph and identify potential memory leaks during development.
Conclusion:
Memory leaks can be elusive and challenging, but with a solid understanding of Swift debugging techniques and the right tools at your disposal, you can effectively identify and address these issues. Prioritize memory management in your iOS development workflow, leverage Instruments for profiling, and adopt best practices such as using weak references and properly managing object relationships. By mastering memory leak detection and prevention, you’ll contribute to the creation of robust and efficient iOS applications that provide a seamless user experience. Happy debugging!